
Making Sense of Expected Goals (Without The Jargon)
2d3b6fec-1c1d-4705-8758-c9cf86c17638.jpg
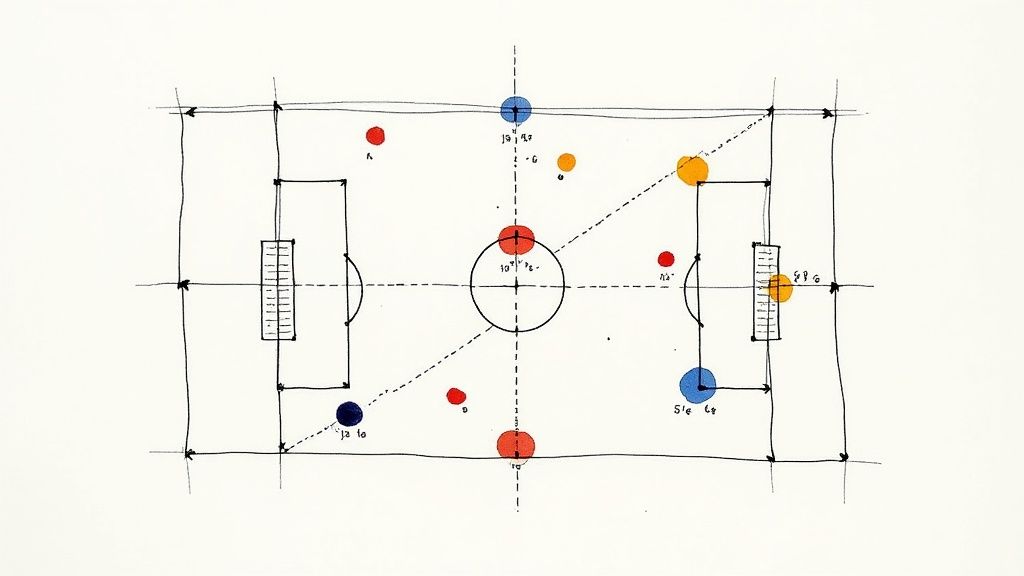
This screenshot from Wikipedia gives you a quick overview of expected goals, showing how it's used in football analytics. It highlights the statistical nature of xG, illustrating how it calculates the probability of a shot becoming a goal based on different elements. We'll explore these elements – things like shot location and the type of assist – in more detail later.
Let's talk about expected goals (xG). Instead of getting bogged down in complex equations, think of xG as a simple way to answer the question: "What were the odds of that shot going in?" It's basically a percentage presented as a decimal. An xG of 0.6 means there was a 60% chance of that shot finding the back of the net. Imagine taking that same shot 100 times under the exact same conditions – the xG predicts roughly how many of those shots would result in a goal.
This approach is valuable because it separates the actual outcome of a match from the quality of the chances a team creates. Imagine a team wins 1-0. Sounds decisive, right? But what if the winning team's xG was just 0.3, while the losing team had an xG of 2.4? That tells a different story, hinting that luck played a significant role. And surprisingly, this isn’t a new idea. The concept of expected goals in UK football actually goes back to a 1993 academic study investigating the impact of artificial pitches. This research suggested that teams playing on artificial turf scored more goals than they "should" have. Want to dig deeper into the history of xG? Check out this Wikipedia article.
Why XG Matters
Expected goals isn't just for dissecting past games; it’s a powerful predictive tool. By understanding the quality of the chances created, we can better evaluate which teams are performing well, regardless of the scoreline. This helps us see beyond the final result and get to the heart of what really happened on the field, and more importantly, what might happen in future matches.
For example, imagine a team consistently creates high xG but struggles to score. Maybe their finishing is off, or they're facing a goalkeeper having a blinder. Over time, these things tend to even out. On the flip side, a team constantly scoring more than their xG suggests might be riding a wave of good fortune, converting chances they shouldn’t realistically be scoring. xG lets us see past these short-term variations and make better judgments about a team's true potential.
How XG Helps You
Understanding xG lets you analyze matches with a greater level of insight. It helps separate luck from skill, highlighting which teams are genuinely creating high-quality chances and which are just getting lucky. This nuanced understanding is invaluable, not only for post-match analysis but also – as we’ll explore later – for making smarter betting decisions. By the end of this guide, you'll have a whole new perspective on football, appreciating not just the what but the why behind the results.
How The Numbers Actually Come Together
Now for the fun part: how are these xG numbers actually calculated? Don't worry, we're not diving into complex algorithms. Just grasping the basic principles will dramatically improve how you understand the data. Think of it like this: every shot taken is evaluated based on a few key elements, much like how you instinctively judge a chance when watching a game.
565124e1-4118-45cc-b73e-532cae2a0a2e.jpg
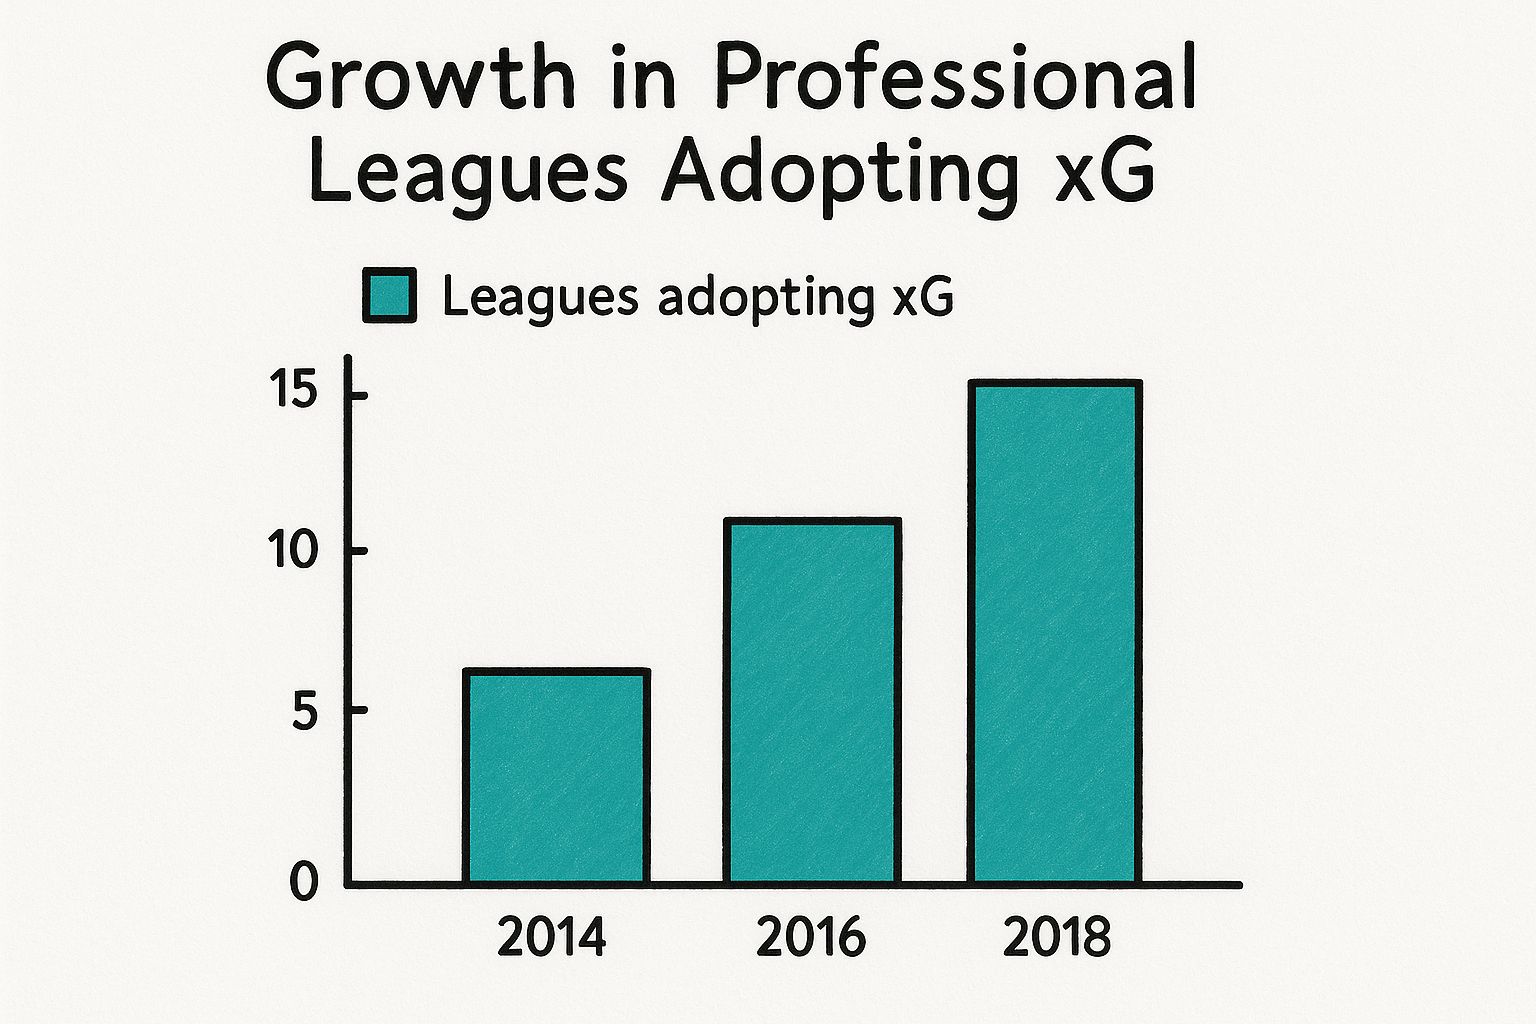
This infographic neatly shows how the use of xG is growing across professional leagues. Seeing more and more leagues using this metric really highlights its increasing importance in football analysis. Teams and analysts are catching on to the power of understanding expected goals.
Distance to goal is a huge factor. A tap-in from two yards out obviously has a higher xG than a screamer from 30 yards. But there's more to it than just distance. The angle of the shot also matters. A shot from the byline, even though it's close to the goal, is a tough angle. And how the chance came about plays a role too. Was it a perfectly weighted through ball, a chaotic scramble in the box, or a beautiful passing sequence? The type of assist significantly impacts xG values.
Dissecting The Key Factors
To really grasp how these factors work together, let's look at a few typical examples. Penalties, for instance, usually have an xG of around 0.76, not 1.0 like you might expect. Why? Because even from 12 yards, penalties aren't automatic goals. Goalkeepers make saves, they’re hit wide, or sometimes even blasted over the bar. The xG value reflects that element of uncertainty.
Headers from crosses frequently have lower xG values than you might initially think. They’re notoriously difficult to control and direct accurately, making scoring less likely. On the other hand, one-on-one situations with the goalkeeper usually have very high xG values, sometimes nearing 0.9 or even higher, as these are prime scoring opportunities.
Let's take a look at some typical xG values to solidify our understanding:
Expected Goals Values for Common Shot Types
This table provides a general overview, and actual xG values can vary depending on the specific situation. However, it demonstrates how different factors influence the likelihood of scoring.
Putting It Into Practice with StatsHub
We can see these concepts in action using StatsHub. Let’s say we're analyzing Liverpool's team stats from last season. You can explore this yourself on StatsHub's Liverpool Team Page. By looking at their shot locations and the types of assists leading to those shots, we can see how their xG was generated and compare it to their actual goals scored. This gives us a deeper insight into their attacking effectiveness than simply looking at their final goal tally.
Understanding how xG is calculated is crucial for interpreting it accurately. Knowing that distance, angle, and the assist type all feed into the xG value allows you to judge the real quality of a team's chances. This understanding sets the stage for using these concepts in in-depth match analysis, which we'll cover in the next section.
Reading Expected Goals Like The Pros Do
225fc7c8-d537-46a6-865d-e2b4ed8a82d1.jpg
This infographic shows how xG changes depending on where a shot is taken. It gives you a quick visual guide to the likelihood of a goal from different positions. Notice how those central areas in the penalty box light up – they're the real goal-scoring hot zones!
Expected goals (xG) isn't just about the scoreline; it's about the quality of the chances created. A single match xG value can be misleading. Football has a knack for throwing curveballs. Sometimes the sitter goes wide, and sometimes a worldie from 30 yards finds the top corner.
This is why looking at xG across multiple matches is key.
Imagine a team consistently racking up high xG over several games but their actual goal count is low. This might suggest they're struggling with their finishing or maybe they’re up against an in-form goalkeeper. Over time, these things tend to even out.
Conversely, a team regularly exceeding their xG might be riding a wave of luck, converting chances they wouldn't normally expect to score.
Spotting Trends and Vulnerabilities
Recognizing xG trends helps you understand a team's true form. A team consistently underperforming its xG is probably due for an upturn in goals, while a team outperforming its xG might be about to see their luck run out. This makes xG a valuable tool for predicting future performance.
Expected goals against (xGA) provides a similar insight into defensive performances. A team with a consistently high xGA, even if they’ve kept a few clean sheets, might actually have a leaky defence masked by good fortune or a heroic goalkeeper. Combining xG and xGA gives you a complete view of a team's strengths and weaknesses at both ends of the pitch.
Practical Frameworks For xG Analysis
How can you actually use xG in practice? A good starting point is comparing a team's xG and xGA over five to ten matches. Look for big differences between xG and actual goals scored, and between xGA and actual goals conceded. Here’s a simple breakdown:
- High xG, low goals: This suggests they're creating good chances but not finishing them. Expect improved attacking output soon.
- Low xG, high goals: They might be scoring, but the quality of their chances isn't great. This scoring form could be unsustainable.
- High xGA, few goals conceded: This could indicate a hidden defensive weakness, perhaps masked by luck or individual brilliance.
- Low xGA, high goals conceded: This might suggest a run of bad luck or individual errors, rather than a systematic defensive problem.
By using these frameworks, you can identify teams finding their form before anyone else, uncover hidden defensive vulnerabilities, and see when a string of good or bad results is hiding the true story. xG isn't just about crunching numbers; it’s about understanding the story they tell and using that to make better predictions. Later on, we'll look at real examples of how xG analysis predicted shifts in team form before they were obvious. You'll see how powerful xG can be when you know how to use it.
Using Expected Goals For Smarter Betting Decisions
Expected goals (xG) gives you a real edge in football betting. It's a deeper look into chance quality, going beyond the sometimes deceptive final score. Think of xG as a probability score. It tells you how likely a shot was to go in, based on things like where the shot was taken from, the angle, and how the assist was made. So, an xG of 0.6 basically means a 60% chance of a goal.
This is incredibly valuable for betting. Imagine a team loses 1-0, but their xG was way higher than their opponent’s. This tells a story of bad luck, a team creating far better chances but not finishing them. This kind of information can inform your next bet, whether you're looking at future match results, over/under goals markets, or even who's likely to score.
Applying xG to Different Betting Markets
So, how do you actually use xG in your betting? Let's look at a few examples:
- Match Results: Don't just focus on the final score. If a team consistently outperforms their xG, a win is likely coming, even if recent results haven't shown it. The opposite is true as well. A team consistently underperforming their xG might be headed for a slump.
- Over/Under Goals: xG is a powerful tool here. Imagine two teams with consistently high xG but a low number of actual goals. An "over" bet might be a smart move. Their luck is bound to change eventually.
- Goal Scorer Markets: Looking at individual player xG can be revealing. You can see which strikers are getting into great positions but missing, versus those who are naturally good finishers. Backing a player with consistently high xG, even if they haven't scored recently, can offer great value.
Identifying Value with xG
The key to successful xG betting is spotting the difference between a team's xG and their actual scores. That's where the real value is. While bookmakers are becoming more data-savvy, they haven't completely caught up. This means a smart bettor can find and use these gaps in their knowledge.
Look for teams with high xG playing against teams conceding a high xGA (expected goals against). Even if the opponent’s been lucky with great goalkeeping, that luck probably won't last. This is often a great betting opportunity.
xG Difference: A Powerful Predictive Tool
Looking at the difference in xG between two teams, rather than just the actual goal difference, can be a much better predictor of future results. This xG difference shows the gap in the quality of chances created. A big, positive xG difference over multiple matches tells you a team is creating far better scoring chances, even if the scores haven't shown it yet. This is a strong indicator for successful betting. We'll look at some real examples later, demonstrating how xG difference could have highlighted valuable bets in past big matches. By understanding expected goals, you're not just betting on the game itself; you're betting on the quality of the game, giving you a real advantage.
Beyond Basic xG: Advanced Metrics That Sharpen Analysis

e728d924-f4b5-4404-92ac-df6cf3d1cabe.jpg
Standard expected goals (xG) gives us a good starting point, but there's so much more to the story. Think of xG as the foundation of a house. It's essential, but you need walls, a roof, and all the other bits to make it a home. Similarly, a family of advanced xG metrics helps us truly understand how teams perform. Basic xG tells you the likelihood of a shot going in, but these advanced metrics reveal why.
Unveiling Defensive Vulnerabilities With xGA
Let's start with expected goals against (xGA). Imagine a team that keeps getting clean sheets. On the surface, their defense looks impenetrable. But what if they're constantly giving away great chances to the opposition? xGA shines a light on this, showing how many goals a team should concede based on the quality of chances they allow. A high xGA for a team with lots of clean sheets might suggest they're relying heavily on a brilliant goalkeeper or just getting lucky – a situation unlikely to last.
Non-Penalty xG: Measuring True Attacking Prowess
Now, let's talk about non-penalty xG. Penalties can skew the picture of a team's attack. They're high-probability scoring chances, but they don't reflect how well a team creates opportunities in open play. Non-penalty xG removes penalties from the equation, revealing which teams are truly creative in attack and which rely on spot-kicks for a significant portion of their goals. Take Liverpool in the 2023/24 Premier League season. Their xG per game was 1.93, suggesting they were creating chances worth almost two goals per match. This number closely aligned with their actual goals scored. For a broader look at xG trends, check out FootyStats.
Unpacking Open Play vs. Set Pieces
We can further refine our analysis with open-play xG and set-piece xG. These metrics dissect a team's attacking approach. Some teams are masters of intricate passing moves, slicing through defenses with surgical precision. Others might be less impressive in open play but deadly from set pieces, capitalizing on corners and free-kicks. These xG variations offer a granular view of attacking patterns. You can also explore team-specific xG data, like Sparta Rotterdam's performance on StatsHub.
xG Per Shot: Quality Over Quantity
Finally, there's xG per shot. Imagine a team that shoots constantly but rarely scores. A low xG per shot suggests they're taking low-probability shots from distance rather than creating high-quality chances closer to goal. This metric helps us distinguish between teams who prioritize a high volume of shots and those who focus on creating better opportunities.
To summarize the different types of xG we've discussed, let's look at the following table:
xG Variations and Their Applications: Comparison of different expected goals metrics and what insights they provide for match analysis
This table highlights the diverse ways xG can be used to understand team performance. By considering these different variations, we gain a much more complete picture.
These advanced xG metrics, combined with a basic understanding of expected goals, give us powerful tools for in-depth match analysis and more informed betting decisions. They add depth and nuance to our understanding, moving beyond simple shot counts to reveal the underlying quality of chances created and conceded.
Expected Goals Myths That Trip People Up
Let's chat about some common misconceptions surrounding expected goals (xG). These misunderstandings can really trip you up when you’re analyzing a match or trying to figure out a smart bet.
Probably the biggest myth is that xG predicts the exact score. It doesn't. xG measures the quality of chances, not the absolute certainty of a goal. Imagine a team with an xG of 2.5 playing against a team with an xG of 1.2. The first team is more likely to score, and likely to score more, but they're not guaranteed to win that specific match.
Think of it like flipping a coin. Even though the odds are 50/50, you could easily flip heads five times in a row. Similarly, a team can underperform its xG in one game, but over many games, the quality of chances created (that xG) will usually be reflected in the final scores.
Another common mistake is thinking all xG models are the same. They’re not. Different providers use different methods, so their xG values will vary. It’s like baking a cake – even with the same basic ingredients, different recipes will produce slightly different results. Always check where your xG is coming from and understand how it's calculated. Some models focus heavily on shot location, while others might emphasize the type of assist or how much defensive pressure the shooter faced. These differences can have a real impact on the final xG number.
Some people also argue that xG removes the human element from football. This is just wrong. xG actually highlights human performance by separating chance creation from chance conversion. It helps us see the difference between players and teams that are great at creating chances (or finishing them) versus those that are just getting lucky. For example, a striker might consistently get into great scoring positions (high xG) but miss the target. xG helps us spot this, revealing an area where they could improve. Check out Brighton's team stats on StatsHub for a real-world example.
There's also a misconception that xG ignores player skill. It doesn't ignore it; it levels the playing field. By treating all players equally, xG can actually help us spot over- and under-performing players. If a player consistently scores more goals than their xG suggests, it might mean they’re an exceptionally skilled finisher. If they consistently score less, it might highlight areas for improvement in their game.
Finally, some people think xG is only useful for looking back at past matches. While it’s certainly valuable for analyzing past performance, xG also provides useful clues about future potential. A team consistently generating high xG but not scoring many goals is likely to see an improvement in their results soon. Conversely, a team consistently scoring more than their xG might be due for a drop-off. Understanding these principles helps you anticipate future trends, spot valuable betting opportunities, and gain a genuine edge in your football analysis. By understanding these limitations and misconceptions, you’ll avoid common pitfalls and make sharper, more informed decisions when you're analyzing a match or placing a bet.
Your Practical Expected Goals Action Plan
Now that we’ve explored the ins and outs of expected goals (xG), from the basics to more advanced metrics and busted some common myths, let's talk about putting this knowledge into action. Think of this as building a playbook for using xG to sharpen your football analysis and, ultimately, make smarter bets. It's not about blindly following the numbers, but weaving them into a richer understanding of the game.
Building Your xG Toolkit
First things first, you need a reliable source of xG data. There are plenty out there, some free and some subscription-based. Free resources like FootyStats and Understat offer basic xG data, while premium platforms like StatsBomb provide a more in-depth look. StatsHub, currently free, also offers comprehensive xG data along with player and team stats for leagues around the world, from the Premier League to La Liga and beyond.
Once you've got your data source sorted, think about your analytical timeframe. Looking at short-term trends (say, 5-6 matches) can highlight immediate shifts in form, while a longer view (10+ matches) gives you a more reliable sense of the bigger picture. For example, a team consistently exceeding their xG over a short period might be due for a dip. Over a longer period, that same overperformance might indicate genuinely clinical finishing. Knowing the difference is key.
Incorporating xG Into Pre-Match Research
So how do you actually use xG when you're previewing a match? Here’s a step-by-step guide:
- Check xG and xGA: Start by looking at both teams' xG (expected goals for) and xGA (expected goals against) over your chosen timeframe. Big gaps between xG and actual goals scored, or xGA and actual goals conceded, are telltale signs. A high xG with few actual goals could hint at a goal-scoring outburst just around the corner.
- Consider xG Difference: Pay close attention to the difference in xG between the two teams. A big positive xG difference suggests one team is creating significantly better chances, even if their recent results don’t reflect it. Imagine Team A averages 1.8 xG and Team B averages 0.8 xG over ten matches. Team A has a clear edge in chance creation, regardless of what the scoreboard has said lately.
- Context Matters: xG isn't the be-all and end-all. Remember to consider the usual factors: team news, head-to-head records, and the context of the game. Think about motivation, fixture congestion, and so on. A cup match against a lower-league opponent can skew xG, as can an early red card. These things happen!
- Combine With the Eye Test: xG quantifies chances, but actually watching matches gives you insight into why a team is over or underperforming their xG. Are they missing easy chances? Facing a goalkeeper having the game of his life? Or is their build-up play simply subpar?
Refining Your Approach
Like anything, practice makes perfect. Keep track of your xG-based predictions. Notice which patterns hold true and which ones fall flat. This feedback loop helps you fine-tune your approach. You might discover xG is a better predictor in certain leagues or for specific types of bets.
Also, be on the lookout for red flags. Big differences between xG and actual results often level out over time. A team consistently conceding more goals than their xGA might be about to tighten up at the back. Conversely, a team outscoring their xG could see their luck run out.
Don't think of xG as a magic crystal ball. It's more like a powerful tool in your analytical toolbox. Combine it with your existing knowledge and observations to get a more complete picture of the beautiful game.
Ready to take your football analysis and betting strategy to the next level? Visit StatsHub.com for free access to comprehensive xG data and unlock the power of expected goals.